The Meter dashboard provides access to all security features, preconfigurations, and network locations through a single interface, allowing for centralized monitoring and control. With Command, Meter is setting a new standard in network management – through technology that seamlessly adapts to your specific needs.
Your network. At your Command.
For decades, managing enterprise networks has meant working around the tools available, not necessarily with the tools you want.
First came the command-line interface (CLI). Fast, powerful, and extremely precise—but also cryptic, intimidating, and inaccessible to most. Then came cloud dashboards. They brought visibility and ease of use but took away some of the control and customization that network engineers needed. Today’s software, especially in networking, often feels more rigid than ever: locked into specific workflows, dependent on structured UI flows, and lacking the flexibility to reflect how teams actually work.
Command changes that.
Meter Command is a new kind of interface: a generative UI that lets you talk to your network. Ask a question, and Command will fetch live data. Describe a task, and Command will perform it. Request a dashboard, and Command will build one from scratch—on the fly and tailored to you.
Command is what happens when a software interface understands your intent and has access to your actual infrastructure. It takes your plain language input and builds precisely what you need, whether that’s a dashboard, a configuration change, or an answer. It does this by leveraging the full Meter stack: our hardware, telemetry, security, cloud services, and real-time data pipelines.
The architecture behind Command
At the heart of Command is a custom intelligence architecture designed to translate user intent into action, accurately and instantly. This system is built on three foundational stages:
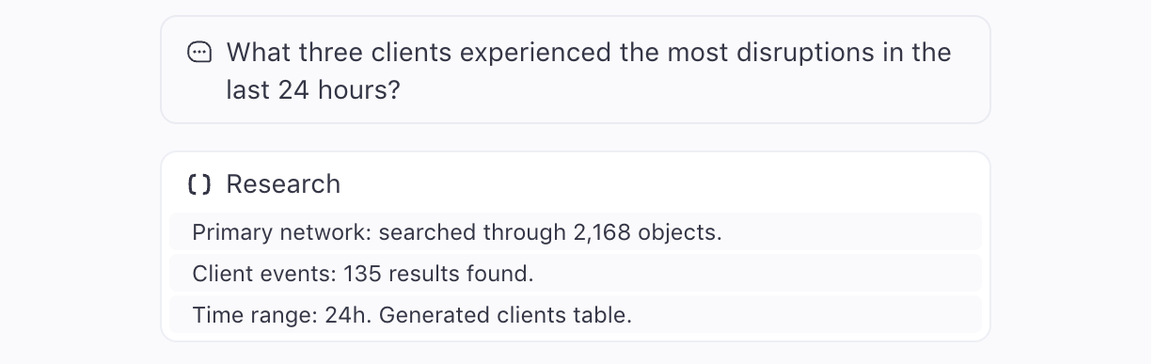
Planning: When you ask Command a question—say, “What three clients experienced the most disruptions in the last 24 hours?”—the system breaks it down. What data does this require? What devices or services are involved? What filters or time ranges are implied? Command plans a sequence of internal steps that map your request to the backend.
Execution: Command then runs those steps in parallel. It pulls live data from multiple sources, filters it based on your request, and organizes it for display. This all happens in milliseconds and allows for complex queries to be answered as fast as a web search.
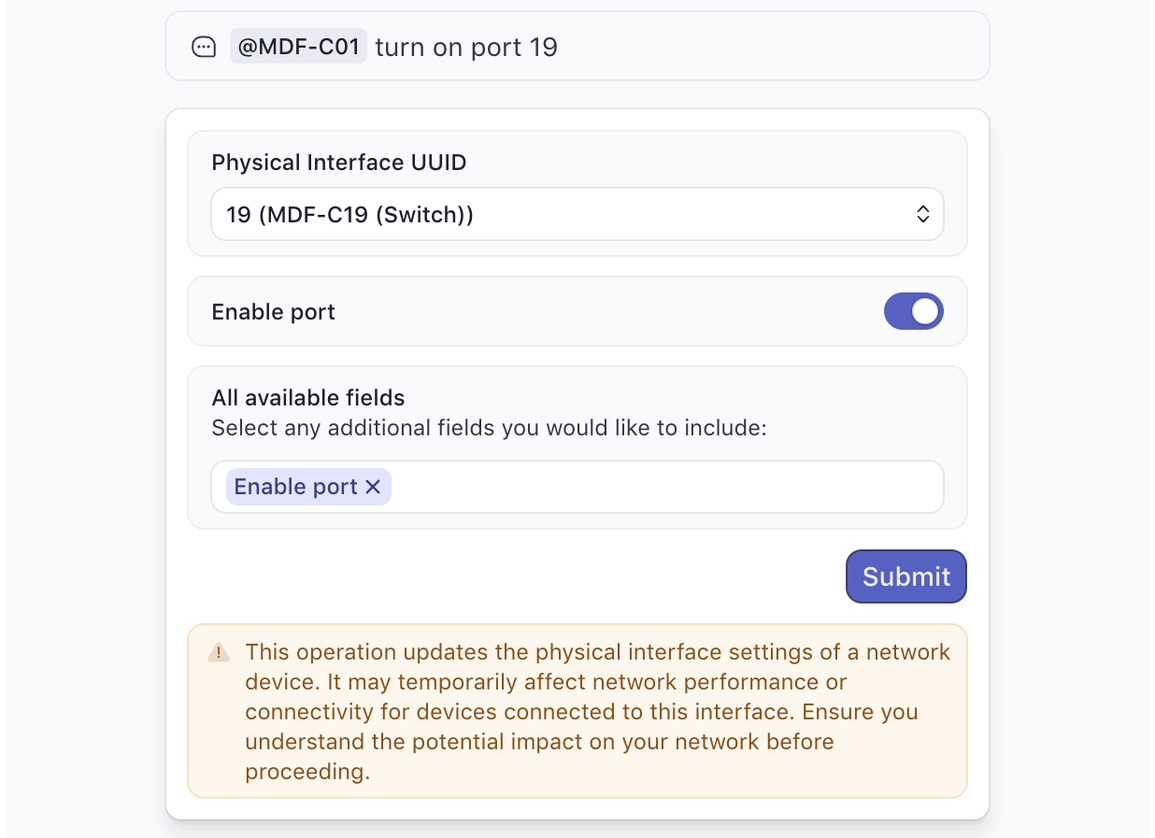
Synthesis: Finally, Command composes a result. That could be a chart, a dashboard, a configuration form, or a concise summary. If the request is actionable—like "Turn on port 19"—it builds an interface to confirm and execute that change, complete with context and safeguards.
Because Command is trained on the way Meter's systems actually work—from frontend logic to backend telemetry—it doesn't just answer questions. It generates fully functional software with accuracy and precision.
Privacy and speed by design
Command is built for performance, but never at the expense of privacy.
Privacy
- All data stays within Meter’s secure infrastructure.
- No customer data is shared with third-party model providers.
- Encryption is applied to all data at rest and in transit.
- Role-based access controls are enforced throughout the stack.
Speed
- Most responses return in under a few seconds.
- Parallel execution architecture dramatically reduces latency.
- Custom model serving infrastructure minimizes overhead.
- Dashboards and components are generated on demand and update in real time.
- Command is fast enough to support your workflow and secure enough to trust with your infrastructure.
How to use Meter Command
1. Type your request
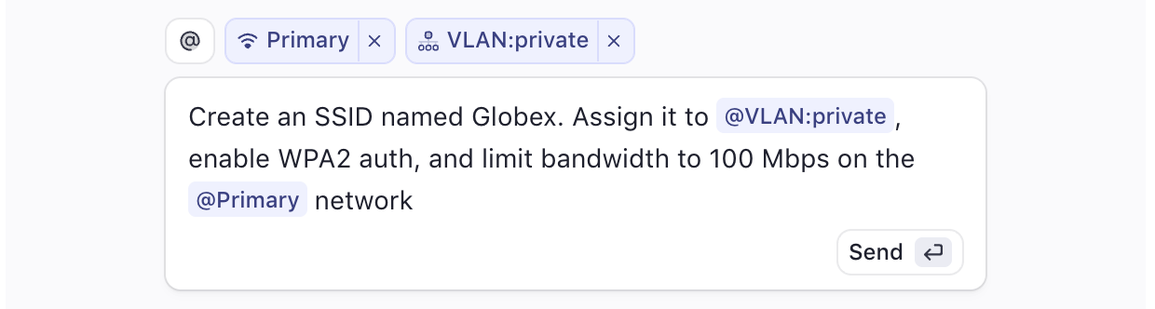
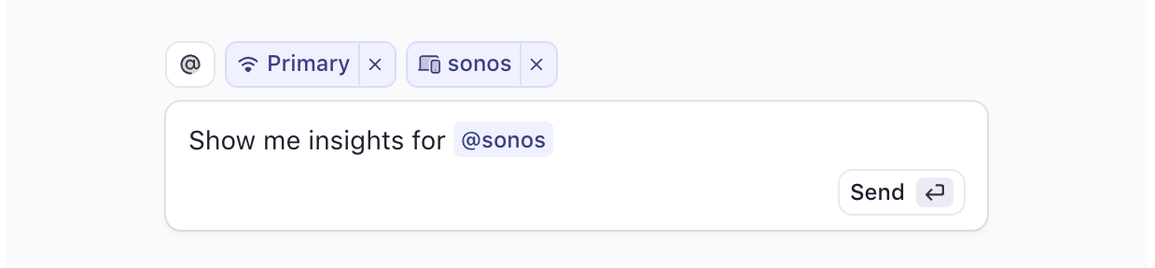
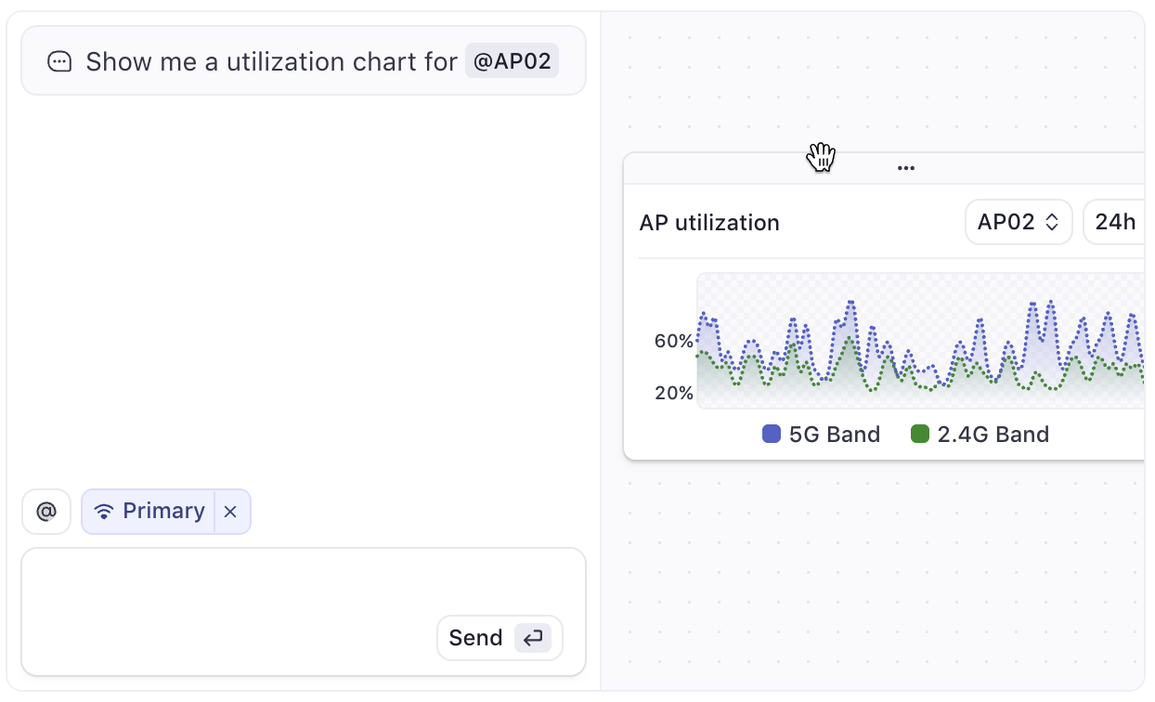
Start by asking Command a question or giving it a task. When referring to a device or object, you will need to tag it through the @ functionality to select a device instead of referring to it only by un-tagged label. You don’t need to use technical syntax, though it supports that too.
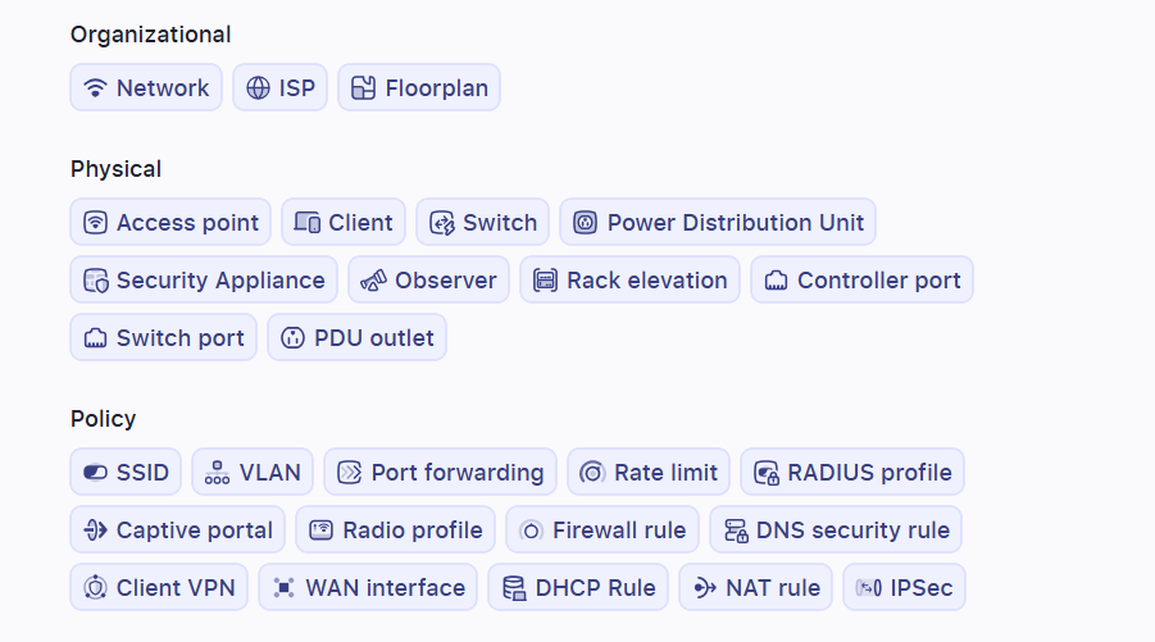
A list of 28 different kinds of objects (see below), ranging from Networks, Clients, Switches, PDUs, WAN Interfaces, among others, will appear when you type @.
2. Review and act
Command will return a live view or pre-filled form based on your input. You can:
- Inspect real-time metrics.
- Confirm and execute configuration changes.
- Save views as dashboards.
- Set alerts or filters.
- Share outputs with your team.
3. Build and share dashboards
Every query can become a dashboard component, simply drag it from the chatbox to the infinite canvas on the right. Group components together by region, use case, or role. You can even create shared workspaces and notebooks for team collaboration.
Command was built for the demands of the coming years. It offers flexibility, speed, security, and an intuitive user experience—giving you full control over your network at all times.

Have questions or want to schedule a Command demo?
Call me or write me an e-mail. I look forward to hearing from you!
+41 78 606 99 41
daniel.schurter@mybn.ch